Key takeaways
- A server can be running and passing health checks while the application on it cannot complete user requests.
- Common hidden causes are database connection exhaustion, slow external APIs, worker exhaustion, slow queries and stalled background jobs.
- On every major cloud, memory and application-level metrics usually need an agent or application instrumentation.
- Metrics show that something is wrong, logs show what happened, and traces show where it happened.
- Find the bottleneck before adding servers. Scaling rarely fixes a slow database, dependency or queue.
Everything looks healthy, but users can't use the app
The following scenario is illustrative.
Support tickets are piling up because checkout keeps timing out. The team checks the cloud console:
- Servers are running.
- CPU is normal.
- The load balancer shows every instance as healthy.
By every infrastructure measure, the system is fine. Users disagree.
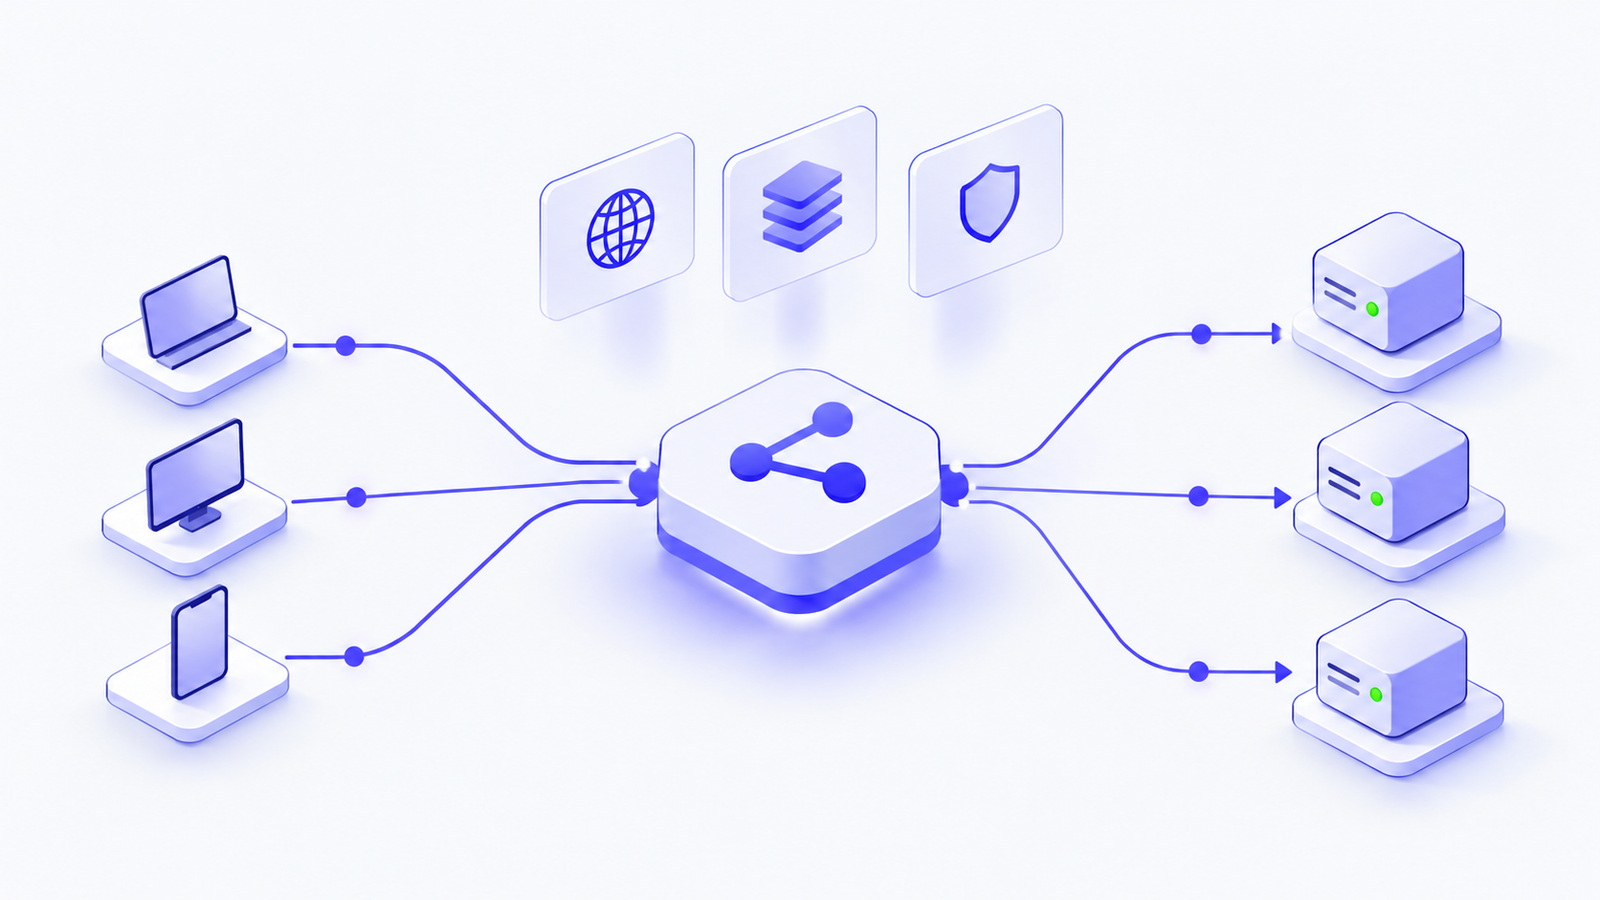
This happens on AWS, Azure and Google Cloud alike. A server can be fully operational while the application on it cannot finish the work users need. The health check passes, but something deeper is stuck, such as a database, a third-party API or a worker pool.
Finding that "something" is the job of observability: understanding what your application is doing from its metrics, logs and traces.
Infrastructure health is not application health
Each layer of monitoring answers a different question:
- Server metrics: is the machine up and how busy is it? They can miss broken application logic.
- Health checks: does a configured endpoint respond? They can miss failures in anything the endpoint doesn't test.
- Application metrics: what are the latency and error rates? They show that something is wrong, but not always why.
- Traces: where does a request spend its time? They only cover the components you have instrumented.
No single check guarantees your application works. Reliable teams combine several.
Five hidden problems that break "healthy" applications
1. Database connection pool exhaustion
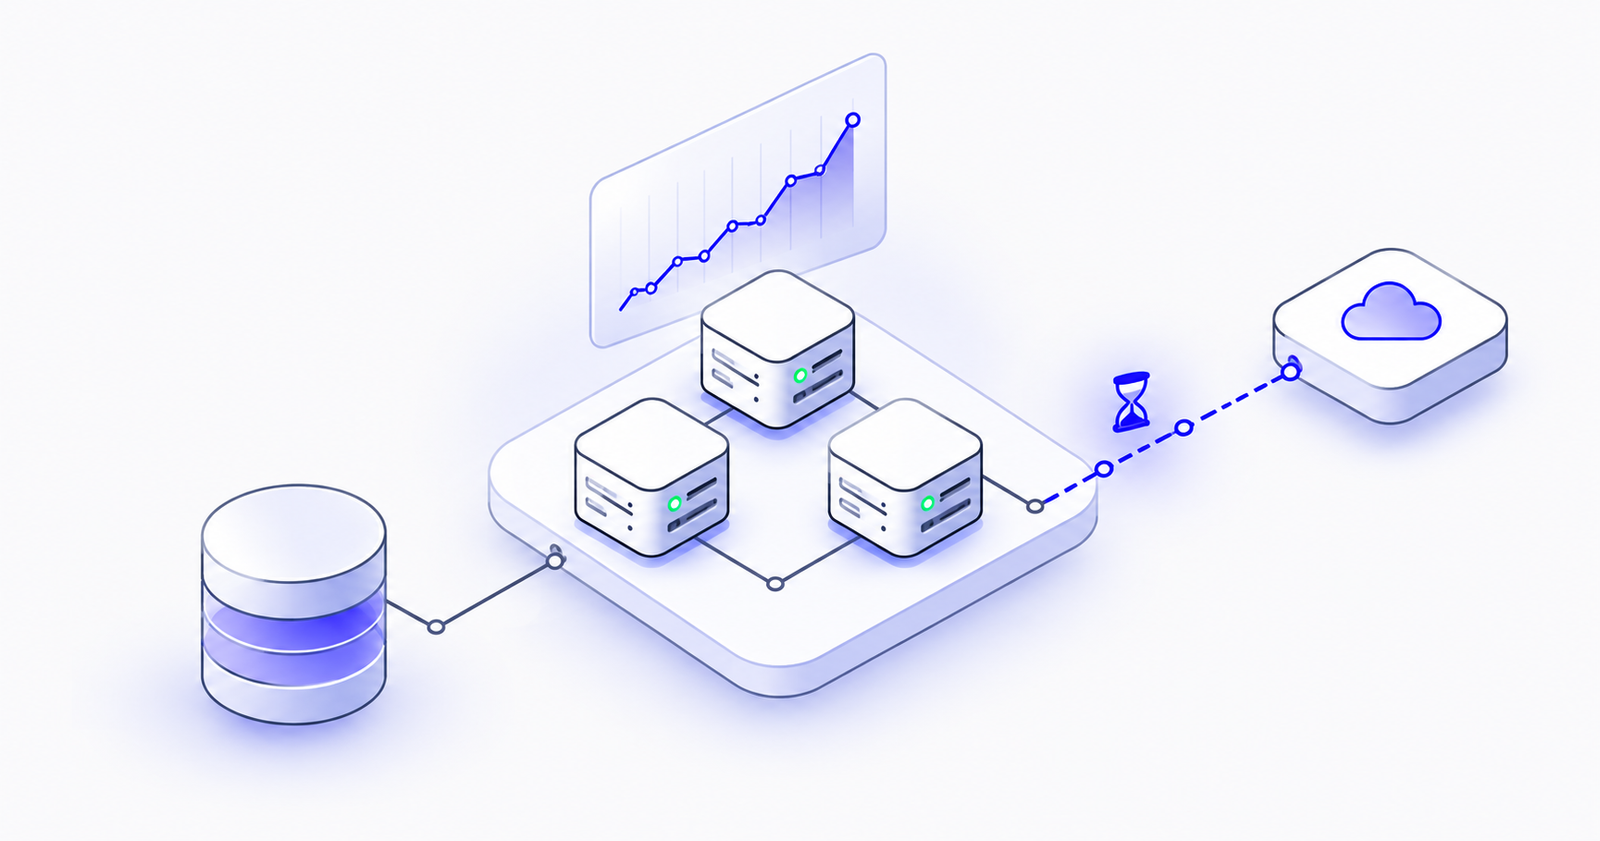
Slow queries or traffic spikes hold database connections too long, and the pool runs out. New requests wait, then time out. CPU stays low because the threads are only waiting.
Fix: set pool and query timeouts, keep transactions short, and alert on pool wait time. Don't just enlarge the pool, because more connections can overload the database further.
2. Slow external APIs
When a payment, login or notification provider slows down, every request that depends on it waits. Aggressive retries make it worse by creating a retry storm.
Fix: set strict timeouts, use limited retries with backoff, and add circuit breakers so the app fails fast. Use idempotency keys before retrying payments so a customer is never charged twice.
3. Memory pressure and worker exhaustion
Workers get stuck on slow calls, memory fills up, or containers hit their limits and restart. CPU can look perfectly normal throughout.
Fix: collect memory and worker metrics, and set timeouts so stuck work is released. Fix leaks instead of relying on restarts to hide them.
4. Slow database queries
A missing index or lock contention slows certain pages, and slow queries also hold connections longer.
Fix: use your database's query insights or slow query log to find the most expensive queries, then review their execution plans. Optimise before you scale the database up.
5. Background jobs that quietly stop
The website works, but emails, reports and scheduled tasks stop processing. Nobody notices for hours.
Fix: alert on the age of the oldest queued message, not just the queue size, and monitor dead-letter queues.
The tools on each cloud
The approach is the same on every cloud. Only the tool names change.
Metrics, dashboards and alerts
- AWS: Amazon CloudWatch
- Azure: Azure Monitor
- Google Cloud: Cloud Monitoring
Logs
- AWS: CloudWatch Logs and Logs Insights
- Azure: Log Analytics
- Google Cloud: Cloud Logging
Tracing and application performance
- AWS: AWS X-Ray and CloudWatch Application Signals
- Azure: Application Insights
- Google Cloud: Cloud Trace
Memory and operating system metrics on VMs
- AWS: CloudWatch agent
- Azure: Azure Monitor Agent
- Google Cloud: Ops Agent
Queue monitoring
- AWS: Amazon SQS
- Azure: Azure Service Bus
- Google Cloud: Pub/Sub
Synthetic checks
- AWS: CloudWatch Synthetics
- Azure: Application Insights availability tests
- Google Cloud: uptime checks
Two points apply to all three clouds:
- Not everything is collected automatically. Load balancers, managed databases and queues publish many metrics by default. VM memory usually needs an agent, and business metrics such as "orders processed" must come from your code.
- OpenTelemetry works everywhere. It is an open standard for collecting metrics, logs and traces, and all three providers support it. AWS now recommends it over the X-Ray SDKs, which entered maintenance mode in February 2026. Instrument once and keep your options open.
Follow the request, don't guess
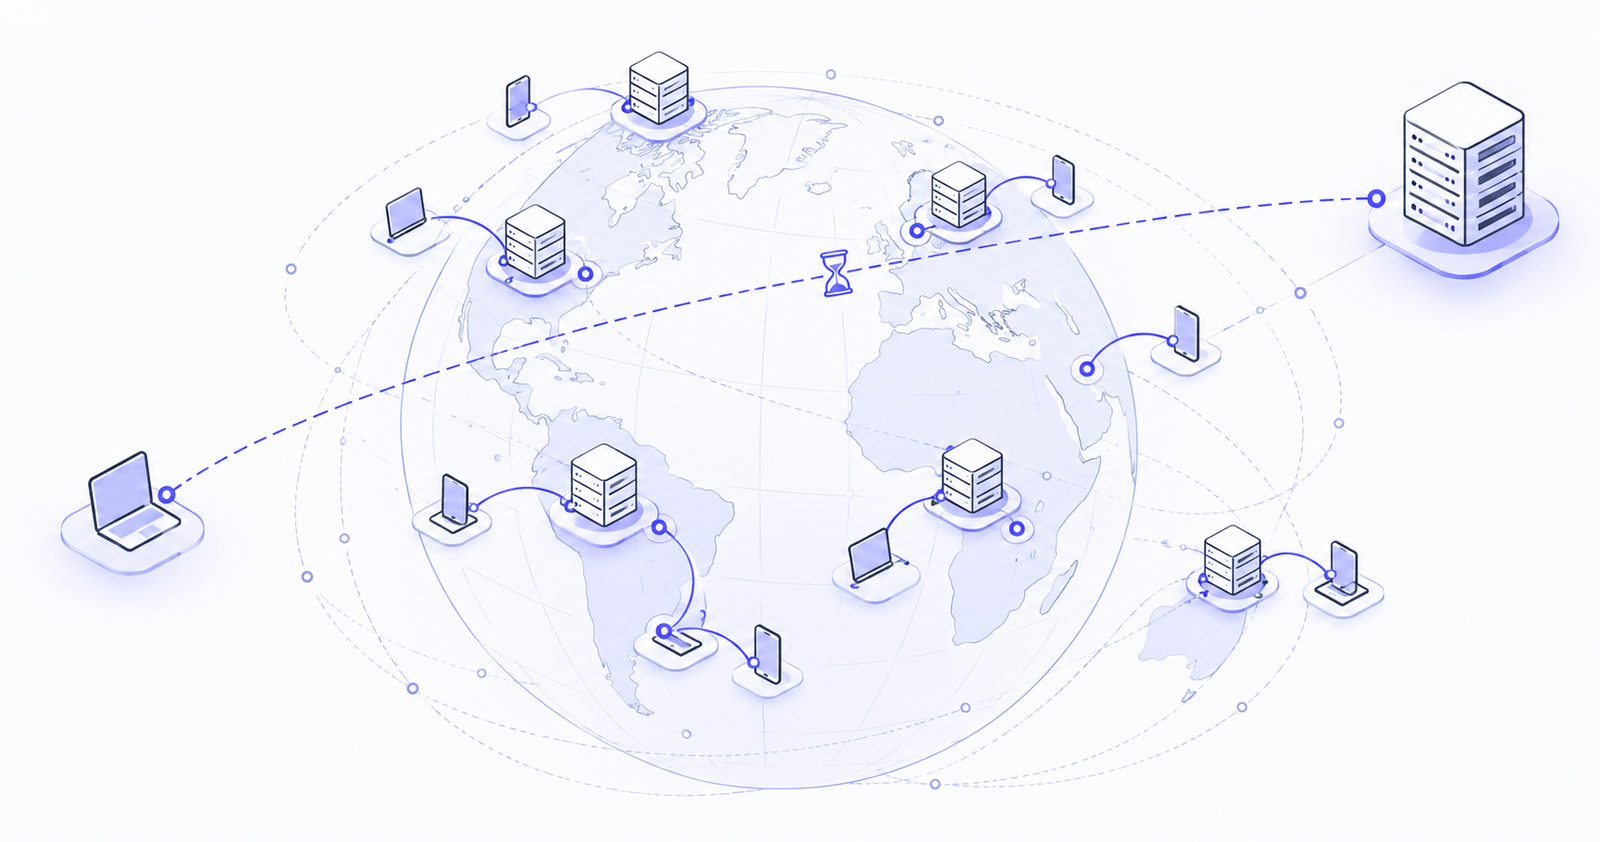
A request travels user → load balancer → application → database or external API. Distributed tracing records how long each step takes.
Illustrative example: an API call takes 4 seconds. The trace shows that the code and the database finish in milliseconds, but a call to a fraud-check service takes almost the entire 4 seconds. Without the trace, the team might have scaled the database. With it, they set a timeout and add a fallback.
Keep it simple:
- Metrics tell you that something is wrong.
- Logs tell you what happened.
- Traces tell you where it happened.
Pass a correlation ID through all three so you can connect them.
A quick troubleshooting workflow
- Confirm which operations are failing, since when, and for whom.
- Compare latency and error rates before and during the incident.
- Check memory, database connections, dependency latency and queue age.
- Search the logs for timeouts and errors, using correlation IDs to link events.
- Trace a slow request to find the slowest step.
- Test your theory, changing one thing at a time.
- Apply the fix and confirm that users can complete their tasks again.
- Add alerts and document the incident so it doesn't happen again.
Adding servers without finding the cause often costs money and fixes nothing.
Better health checks
A health check is only as useful as what it tests. Use three kinds:
- Liveness: is the process alive? Keep this check simple.
- Readiness: can this instance serve traffic right now?
- Synthetic checks: can a real user action, such as logging in or checking out, actually be completed?
Be careful not to make every health check depend on a shared database. A brief database problem could then mark all instances unhealthy at the same time.
Quick checklist
- Latency and error-rate alerts for key user actions
- Memory metrics collected by an agent
- Database connection and slow-query monitoring
- Timeouts and limited retries for every external API
- Alerts on queue age and dead-letter queues
- Structured, searchable logs with correlation IDs
- Tracing on critical paths
- Synthetic checks for key user journeys
- No secrets or personal data in logs
Conclusion
On AWS, Azure or Google Cloud, healthy servers are only the beginning. Real reliability comes from watching what users experience: latency, errors, dependencies and background work, connected through metrics, logs and traces.
Need help finding what's really breaking your application? The Pentafox Cloud team helps businesses improve monitoring, troubleshooting and reliability on AWS, Azure and Google Cloud. Get in touch for a reliability review.